We tested a popular 7-rule put-selling plan
A rule set for selling cash-secured puts is making the rounds. We modeled the parts that can be tested and compared them with simply selling every month, and with just owning the stock.
The rules, in our words
- Only open a new put on a down day (close below the prior close).
- Buy it back once it has lost half its value (50% profit).
- Stick to a short list of quality stocks.
- Only sell when implied volatility is relatively high (we read this as IV rank ≥ 50).
- Only sell when both the daily and weekly trend are up (we used 34/50-day and 34/50-week EMA crossovers as a stand-in for “EMA clouds”).
- Use the premium to buy long-dated calls (not modeled here).
- Stay consistent for years.
Hypothetical model, not real option prices. Daily split-adjusted closes (yfinance). Cash-secured puts priced with Black-Scholes, using an IV proxy = 30-day realized volatility × 1.2 (an assumption, not actual implied volatility), 4% rate, no dividends. ~27.5-delta short put, ~35 calendar days to expiry, marked daily, $0.65 fee per fill, no bid/ask slippage. One position per ticker. Expiring in the money = loss at expiry intrinsic value (no wheeling into stock). $ figures are per 1 contract; buy-and-hold is 100 shares.
We tested all 16 on/off combinations of rules 1, 2, 4 and 5 on four stocks: NVDA, AMZN, NBIS and SPCX. Windows: the last 5 years for NVDA and AMZN, and all usable history for the two newer listings.
Key results
| Ticker / window | Rule | Trades | Win% | Total $ | Max DD $ | Worst trade $ |
|---|---|---|---|---|---|---|
| NVDA, 5y | Buy & hold | – | – | 20,758 | 5,512 | – |
| NVDA, 5y | Every ~35 days, hold | 50 | 86.0 | 12,277 | 1,257 | -277 |
| NVDA, 5y | Red day + 50% profit | 104 | 95.2 | 15,824 | 1,614 | -292 |
| NVDA, 5y | All rules + 50% profit | 33 | 90.9 | 6,600 | 1,427 | -295 |
| AMZN, 5y | Buy & hold | – | – | 9,437 | 10,298 | – |
| AMZN, 5y | Every ~35 days, hold | 50 | 80.0 | 4,602 | 4,058 | -2,920 |
| AMZN, 5y | Red day, hold | 48 | 87.5 | 7,548 | 2,827 | -2,281 |
| AMZN, 5y | All rules + 50% profit | 15 | 86.7 | 420 | 5,022 | -3,014 |
| NBIS, 1y | Buy & hold | – | – | 10,070 | 13,847 | – |
| NBIS, 1y | Every ~35 days, hold | 10 | 100 | 12,528 | 2,374 | +575 |
| NBIS, 1y | All rules + 50% profit | 8 | 87.5 | 5,117 | 5,302 | -3,241 |
| SPCX, ~11 wks | Buy & hold | – | – | 4,399 | 1,706 | – |
| SPCX, ~11 wks | Every ~35 days, hold | 3 | 100 | 1,791 | 451 | +137 |
| SPCX, ~11 wks | Red day + 50% profit | 9 | 100 | 3,166 | 246 | +115 |
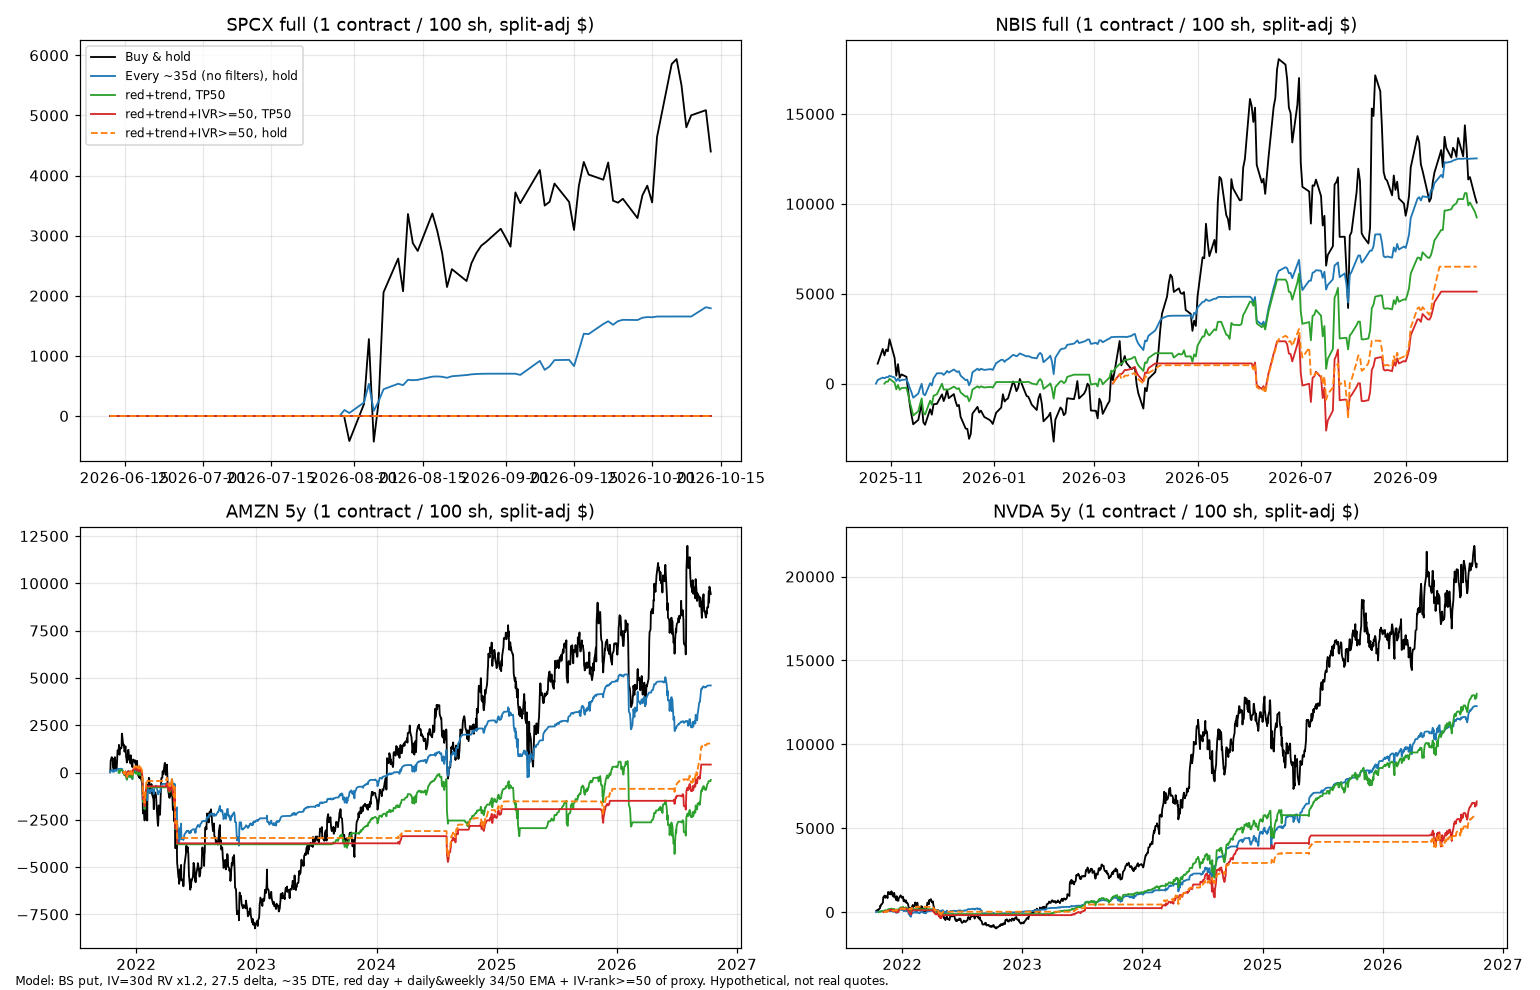
What held up, and what didn’t
- The down-day entry rule held up. It was the one filter that helped fairly consistently: a higher win rate and a smaller drawdown or worst trade on AMZN, NVDA and SPCX. NBIS was mixed.
- The trend and IV filters cut profit. They removed roughly 40–75% of trades and lowered total P&L in every window. The IV filter lowered drawdown on NVDA but not on AMZN or NBIS. With every filter stacked, AMZN made just $420 over 5 years in the model.
- 50% profit-taking raised win rate and total on NVDA and AMZN, mostly by allowing about twice as many trades, but it often made the drawdown and worst trade larger.
- Buy-and-hold made the most money on all four. These stocks rallied hard over these windows. The cost was much bigger drawdowns: on NBIS, $13,847 for shares vs $2,374 for monthly puts. AMZN was the exception, where puts didn’t reduce drawdown much.
Caveats
- SPCX has only ~85 trading days of data (3–9 trades), so the trend and IV filters, which need a year of history, never trigger. NBIS has about 2 years (4–21 trades after a 1-year warm-up). Treat both as anecdotes.
- Four strong-trending stocks over a mostly rising market. Results in a long bear market could look very different.
- The IV proxy is not real implied volatility, and real put premiums and skew differ. Use this for comparing rules, not as expected income.
Get one study a week
Plain-English backtests. No signals, no hype. Free rule card when you join.
Opens our Beehiiv signup page to confirm. Or subscribe free on Beehiiv. Unsubscribe anytime.